
Overview
One of the pillars and value propositions of Prisma Campaigns is leveraging data not only for message personalization but also to gain a 360-degree view of the customer, enabling the delivery of the best offerings at the right time.
To achieve this goal, it is essential to provide clients with tools that allow them to seamlessly and automatically connect their data into the platform.
Goal
Connect and keep financial institutions' data updated to deliver personalized experiences to their customers.
My Role
Responsible for the entire design process, from research to final execution.
Target Audience
DBAs, IT System Admin. Marketing Specialists
Problem
Missing Real-Time DataManual data uploads slow updates and lead to errors.
Lack of ScalabilityGrowth in data volume outpaces manual update capabilities.
Complex Data IntegrationDiverse data formats make integration complex and error-prone.
Solution
Provide an easy-to-use, scalable, and adaptable solution that enables financial institutions to connect and keep their data updated on the platform effectively.
Process
Using problem-solving techniques like human-centered design helps me a lot to put the user at the center of the process, and focus on the users' wants, pain points, and preferences on each part of the process to achieve the best result.
Learning about data
Data was not my area of expertise, and I didn’t want to attempt finding a solution without first thoroughly understanding the subject. My initial goal was to research the most common types of data used by financial institutions, the tools they rely on, and how data is processed and managed.
After gaining a clearer picture of the topic, I started engaging with our clients.
Interviews
This stage was crucial to understanding the diverse realities of our clients.
Not all financial institutions have the same resources for managing their data, so understanding their specific circumstances would help us design a solution that is adaptable to their needs.
Some of the questions asked during the interviews included:
- What are the most common challenges you face when loading data?
- How often do you need to update data?
- Which tools do you commonly use for data synchronization?
- How do you map data fields from the source system to the target system?
- What techniques do you use to transform data into the format required by the new system?
- How the financial institution organize their data?
These questions provided the initial input for me to start the process of defining the problem and proposing a possible solution.
Interviews
1-1 Zoom Meetings
Customers
5 customers
Time
1 week.
Mapping the parts
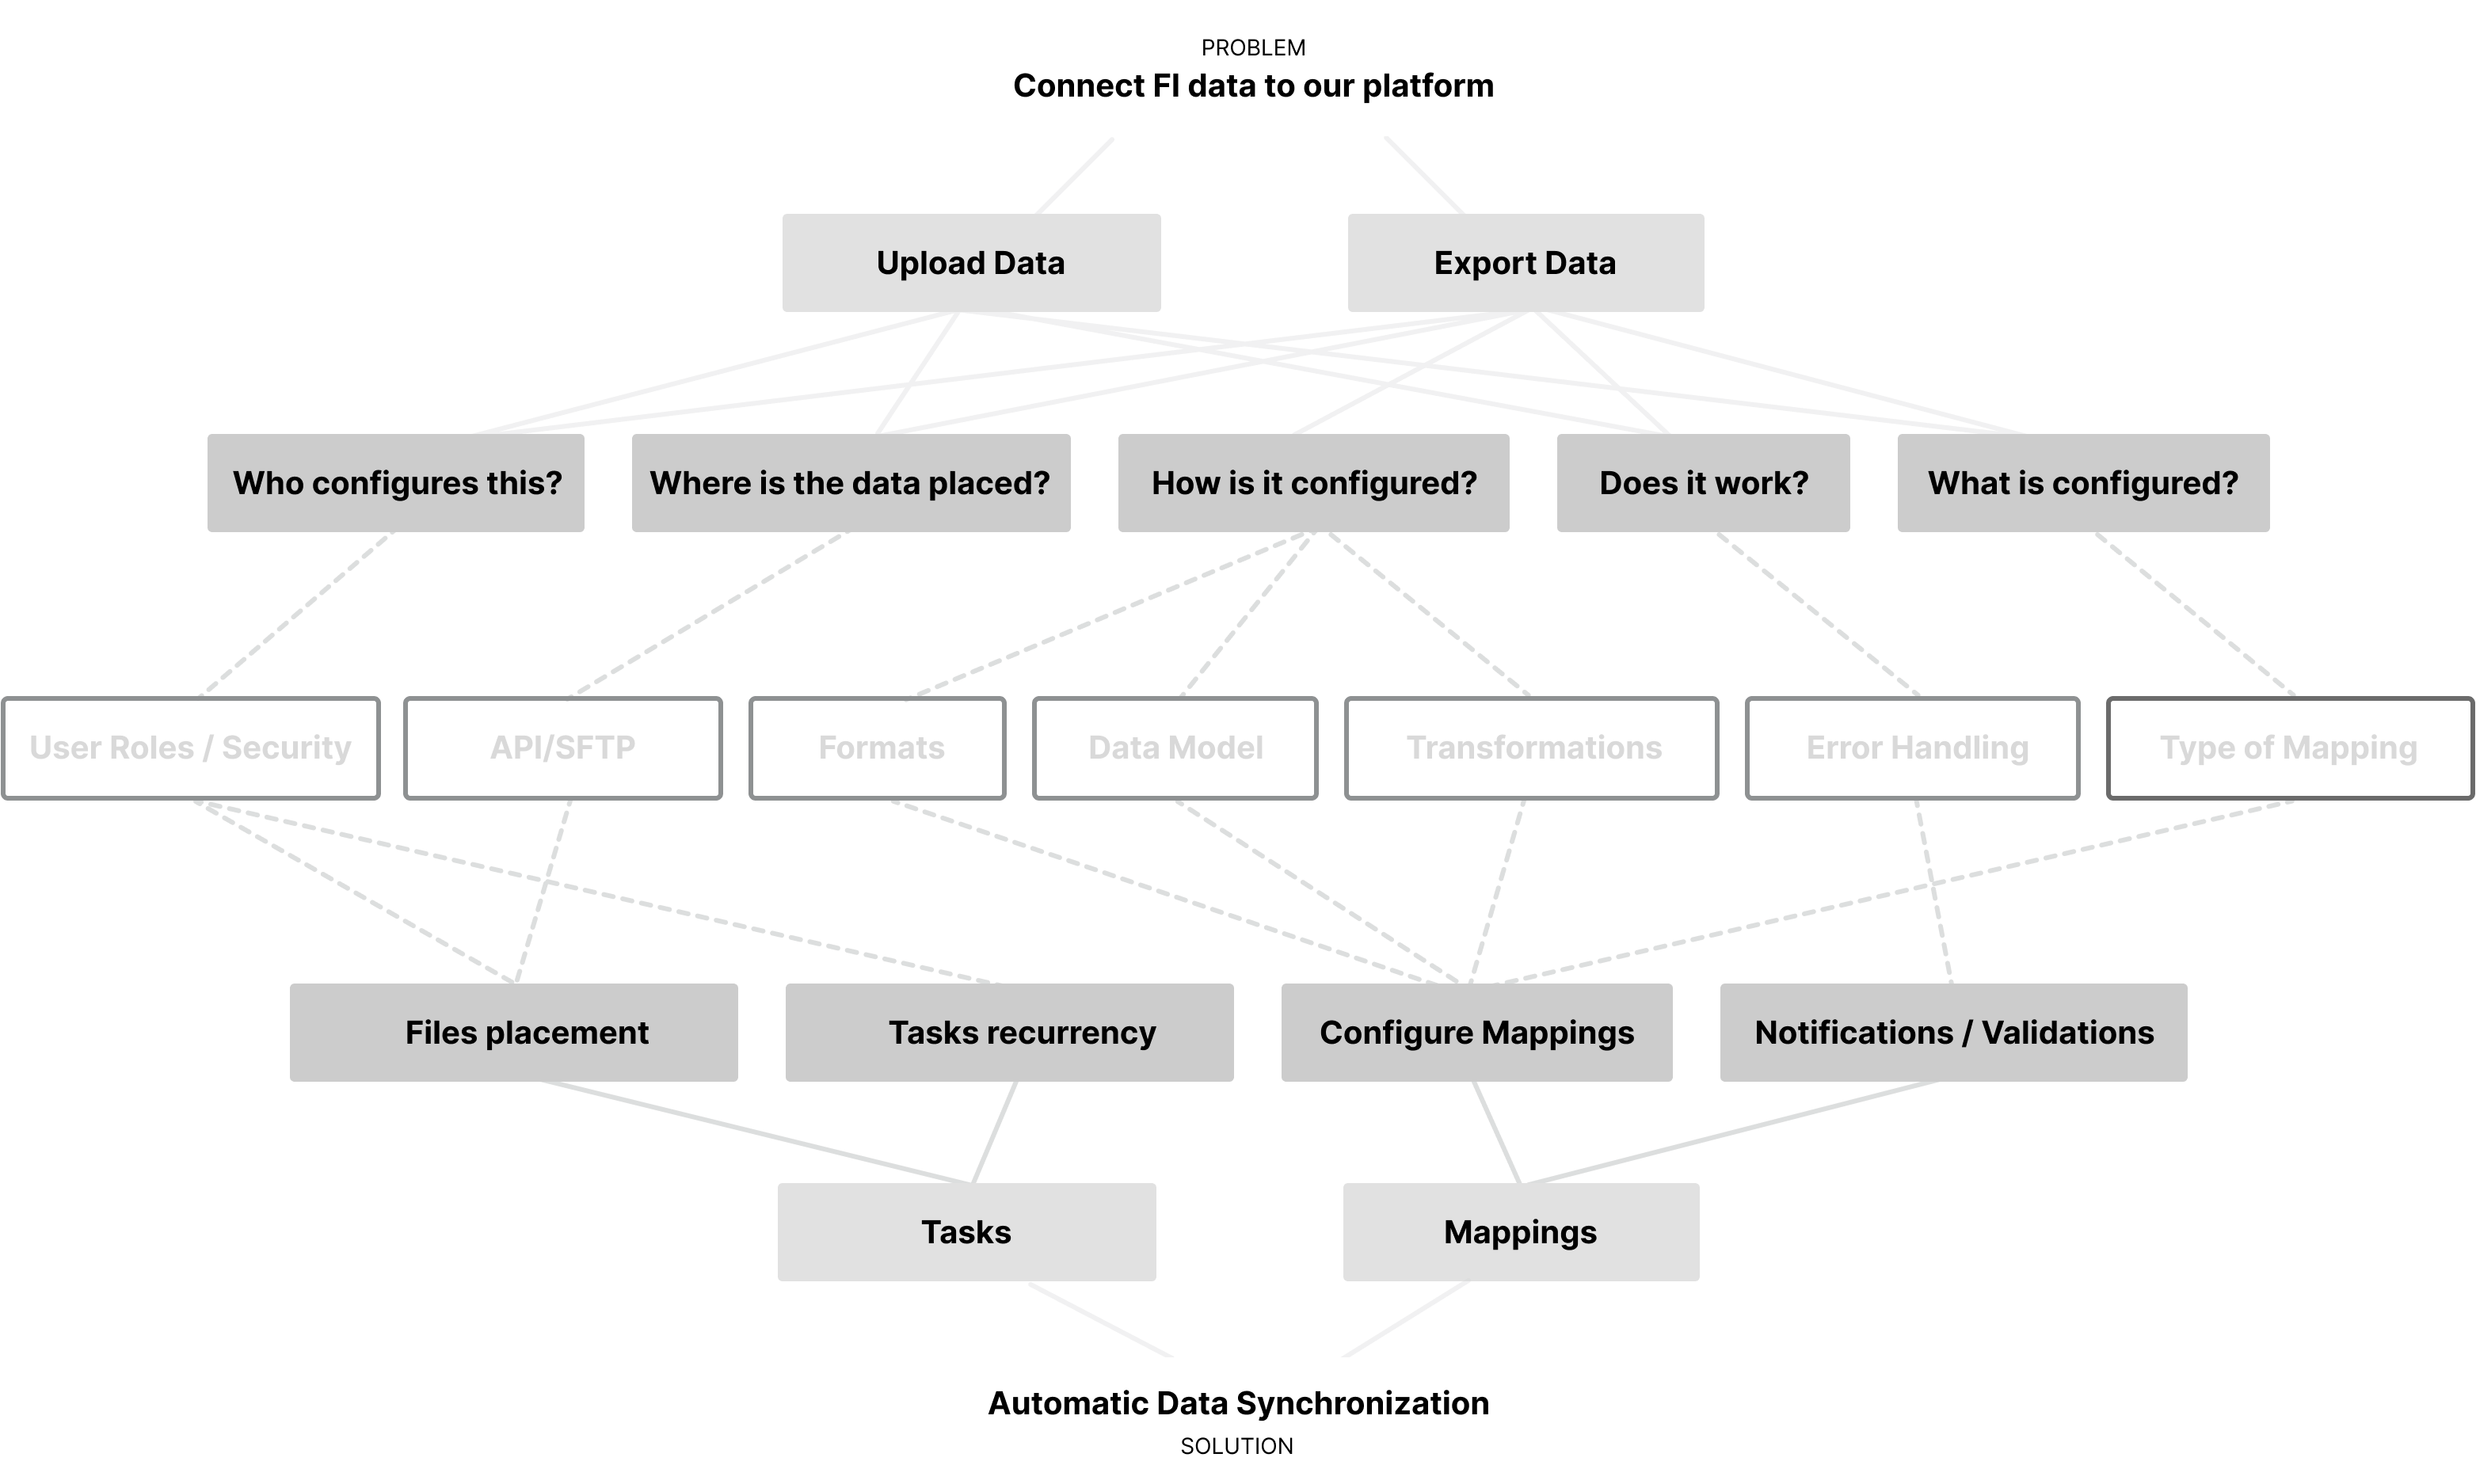
To begin working on the solution, I applied the First Principles approach, which allowed me to break the problem down into smaller parts. This provided a solid foundation to start developing the solution.
I always find this strategy to be an excellent exercise for effectively communicating the rationale to the team. It clearly outlines the items that need to be addressed and the context in which they exist.
Conceptualization
First iteration
The first step was to determine where to host the screens for configuring synchronization tasks.
Since the platform already had a Settings section that housed other configuration screens, the most intuitive choice for the user was to place them there.
Additionally, this section was already segmented by roles, which aligned well with the need to restrict access to the configuration screens to the appropriate individuals.
Prototypes
Low fidelity mockups
# of Iterations
2
Time spent in total
3 weeks

Data Synchronization list
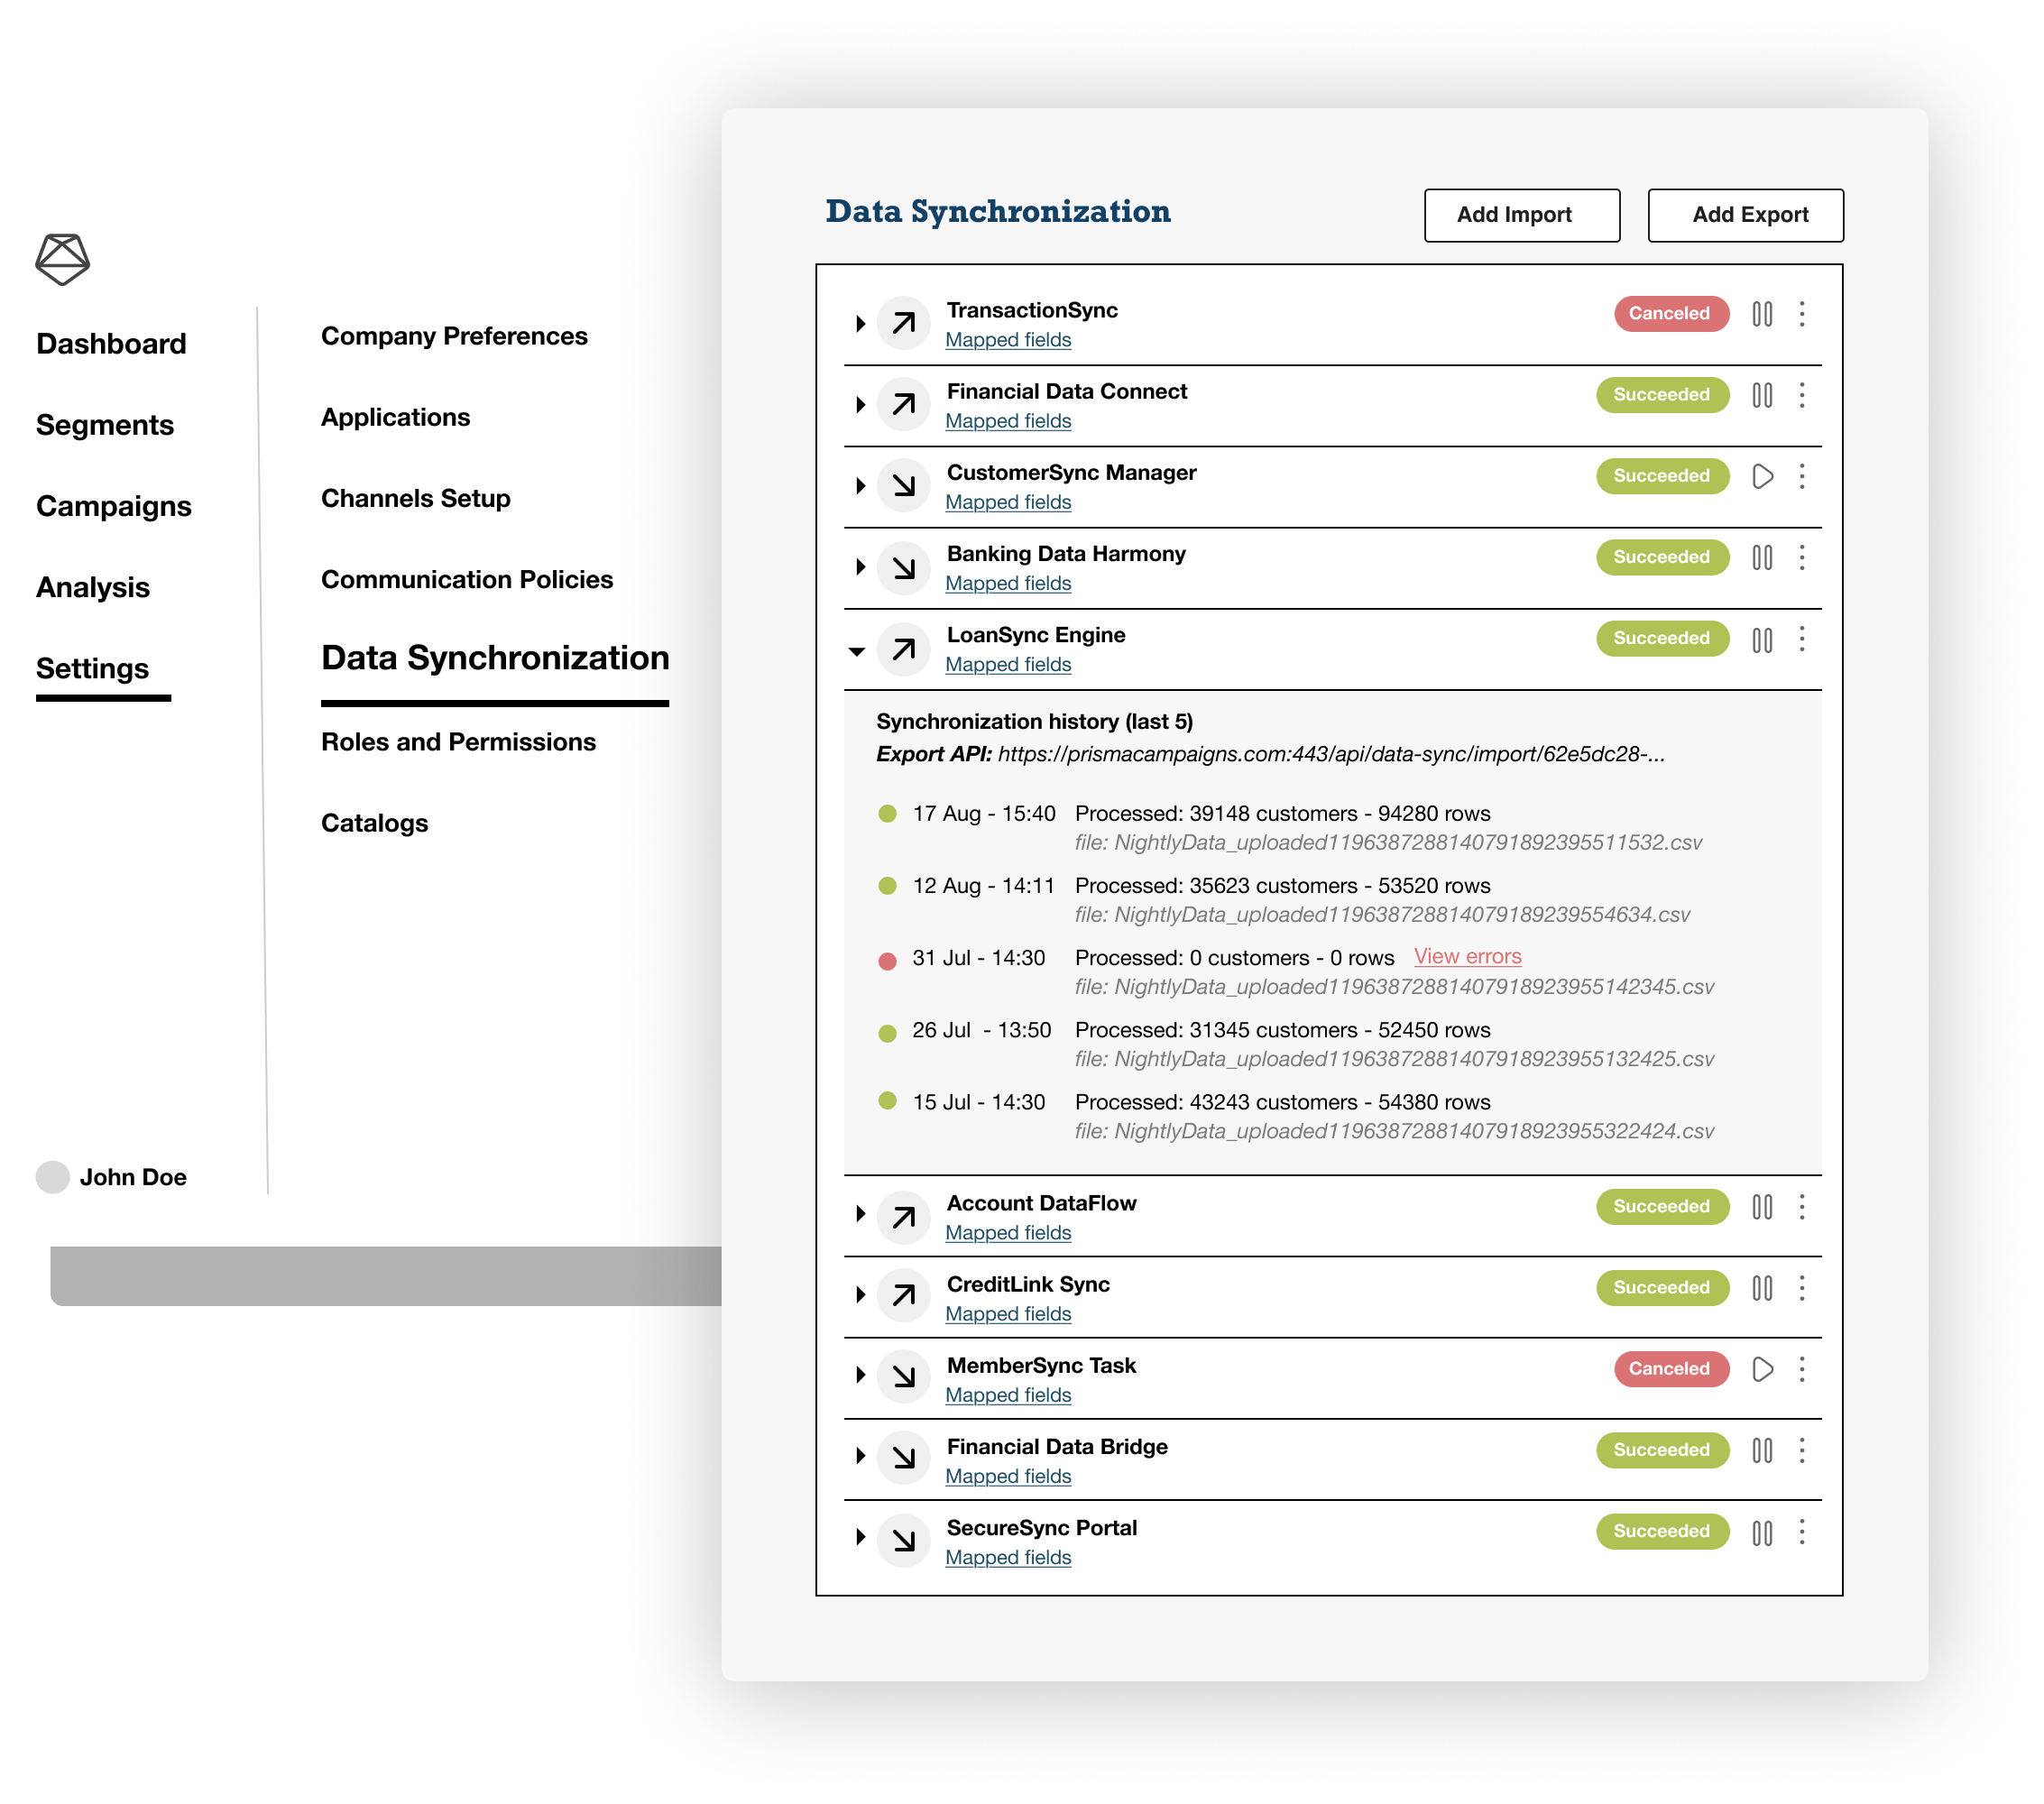
To design this screen, I considered key insights gathered during the interviews:
[Scalability]
Presented tasks in rows for better readability and scalability, even with extensive lists.
[Monitoring]
Used status badges—green for success, red for errors—to quickly identify issues.
[Task details]
Added icons to distinguish Export and Import tasks, with a collapse/expand feature for quick access to details, including:
- Connection endpoints.
- Error details for troubleshooting.
- Last synchronization timestamp.
- Recent synchronization attempts.
[Actions]
Tasks run automatically, but users can pause or temporarily stop them without deleting.
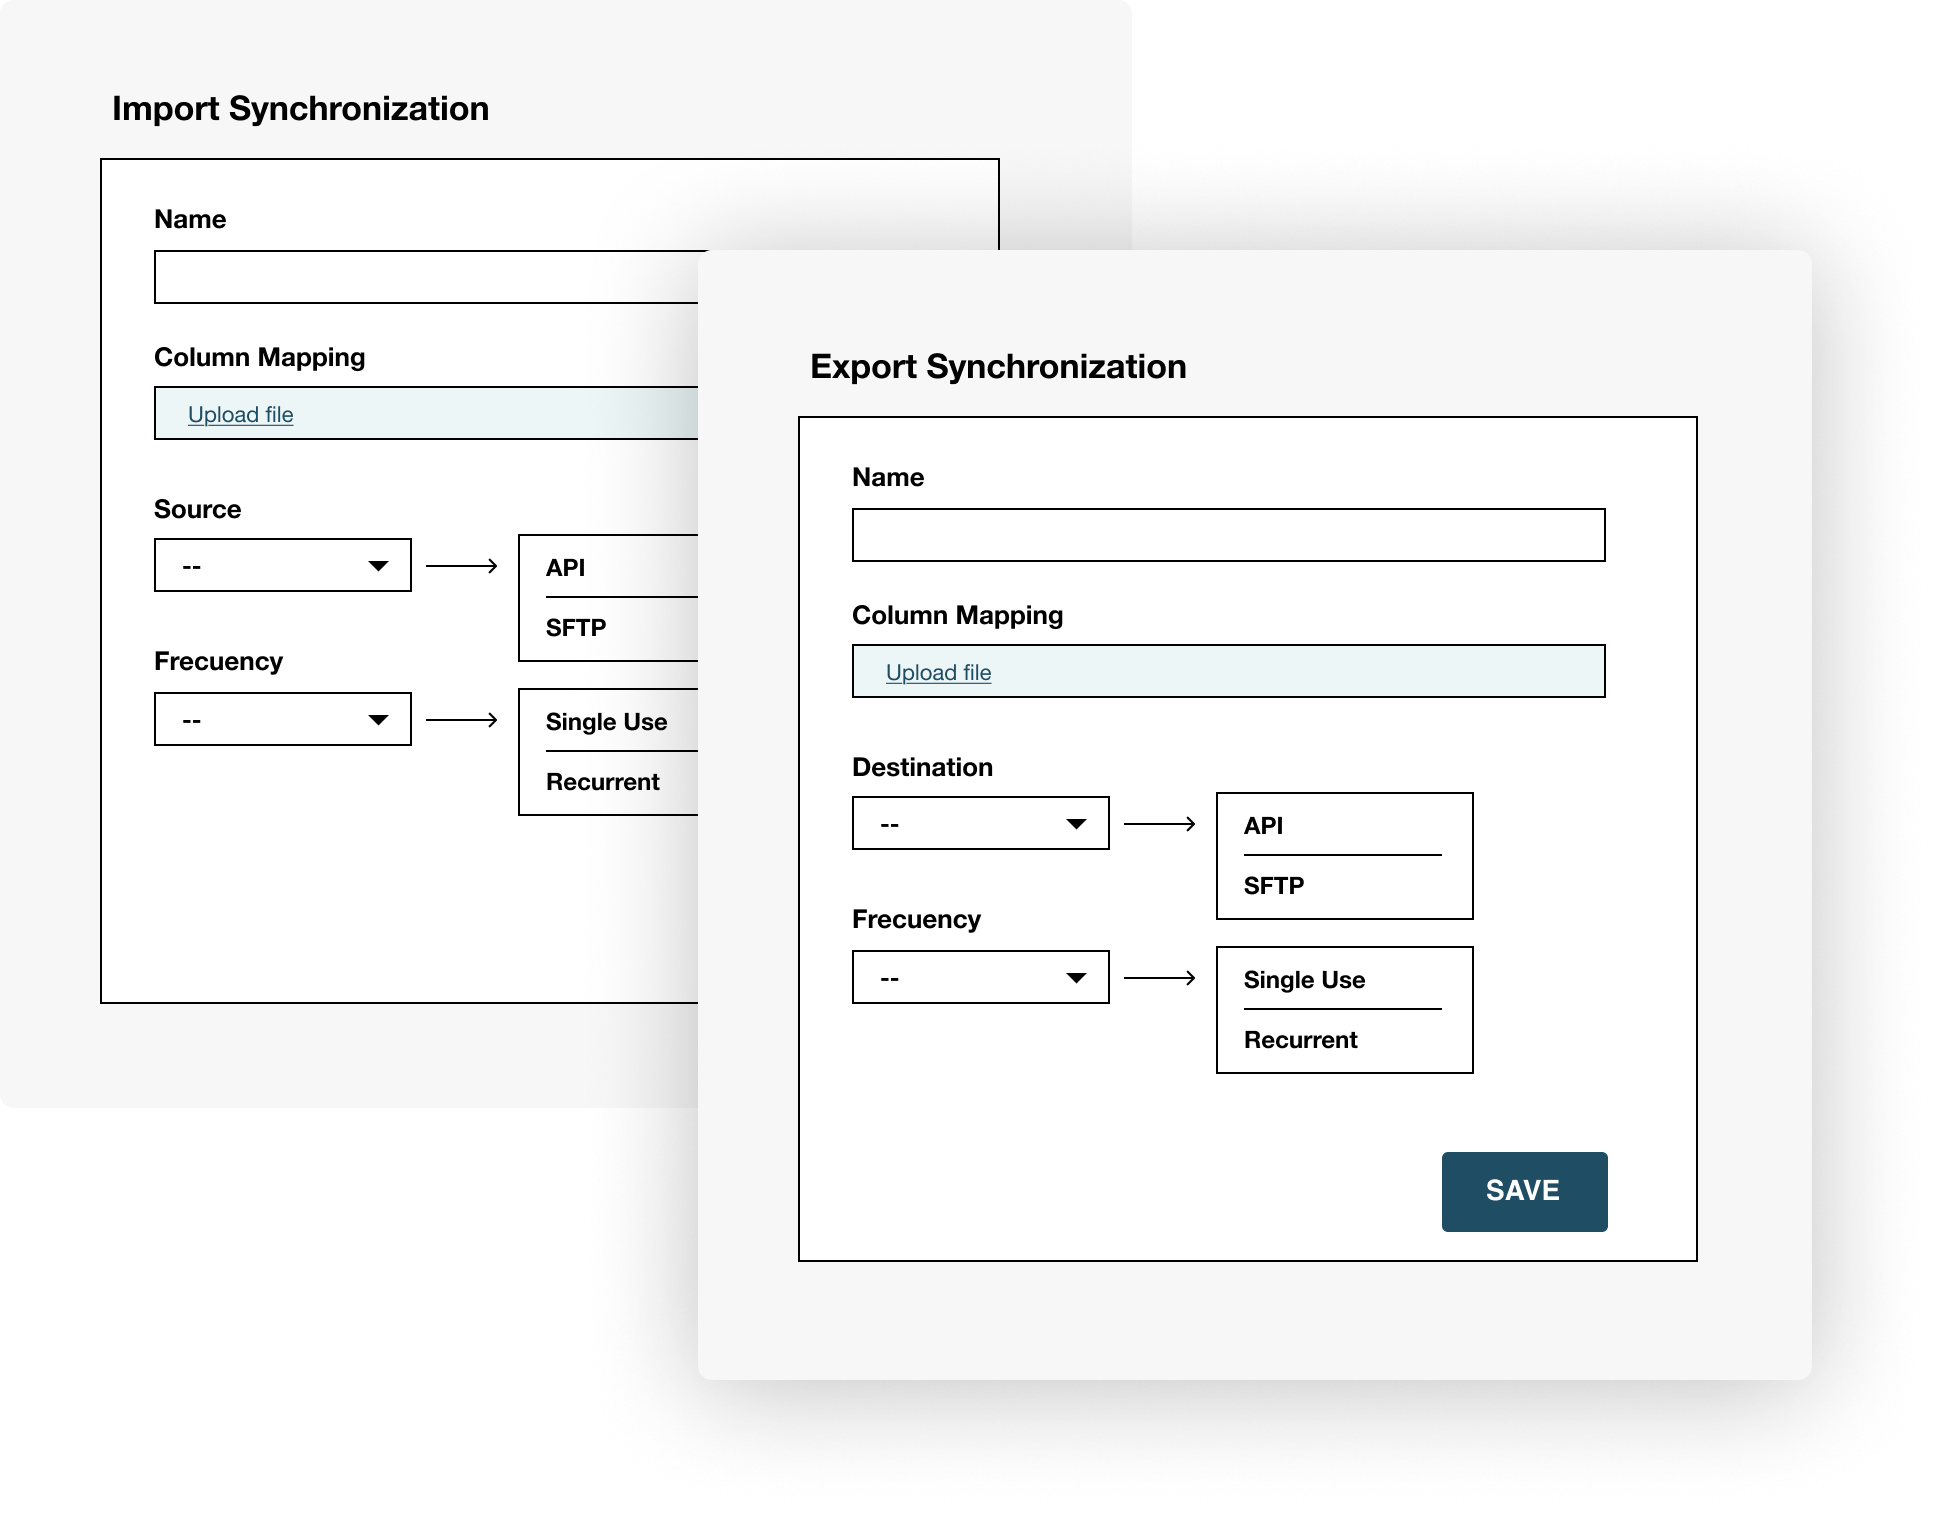
New Task
Once the Add Import or Add Export button is pressed, a small form appears to define the following:
Task Name
A unique name for the task.
Mapping
Configured by uploading a sample file containing its columns and at least 100 rows.
The system automatically identifies field types based on the sample and attempts to map them to the system’s fields automatically.
Source or Destination (depending on the task)
Specifies the mechanism for file input/output, which can be either API or SFTP.
Frequency
Defines how often the system runs the task, whether it involves fetching a file or exporting and depositing it at the configured destination.
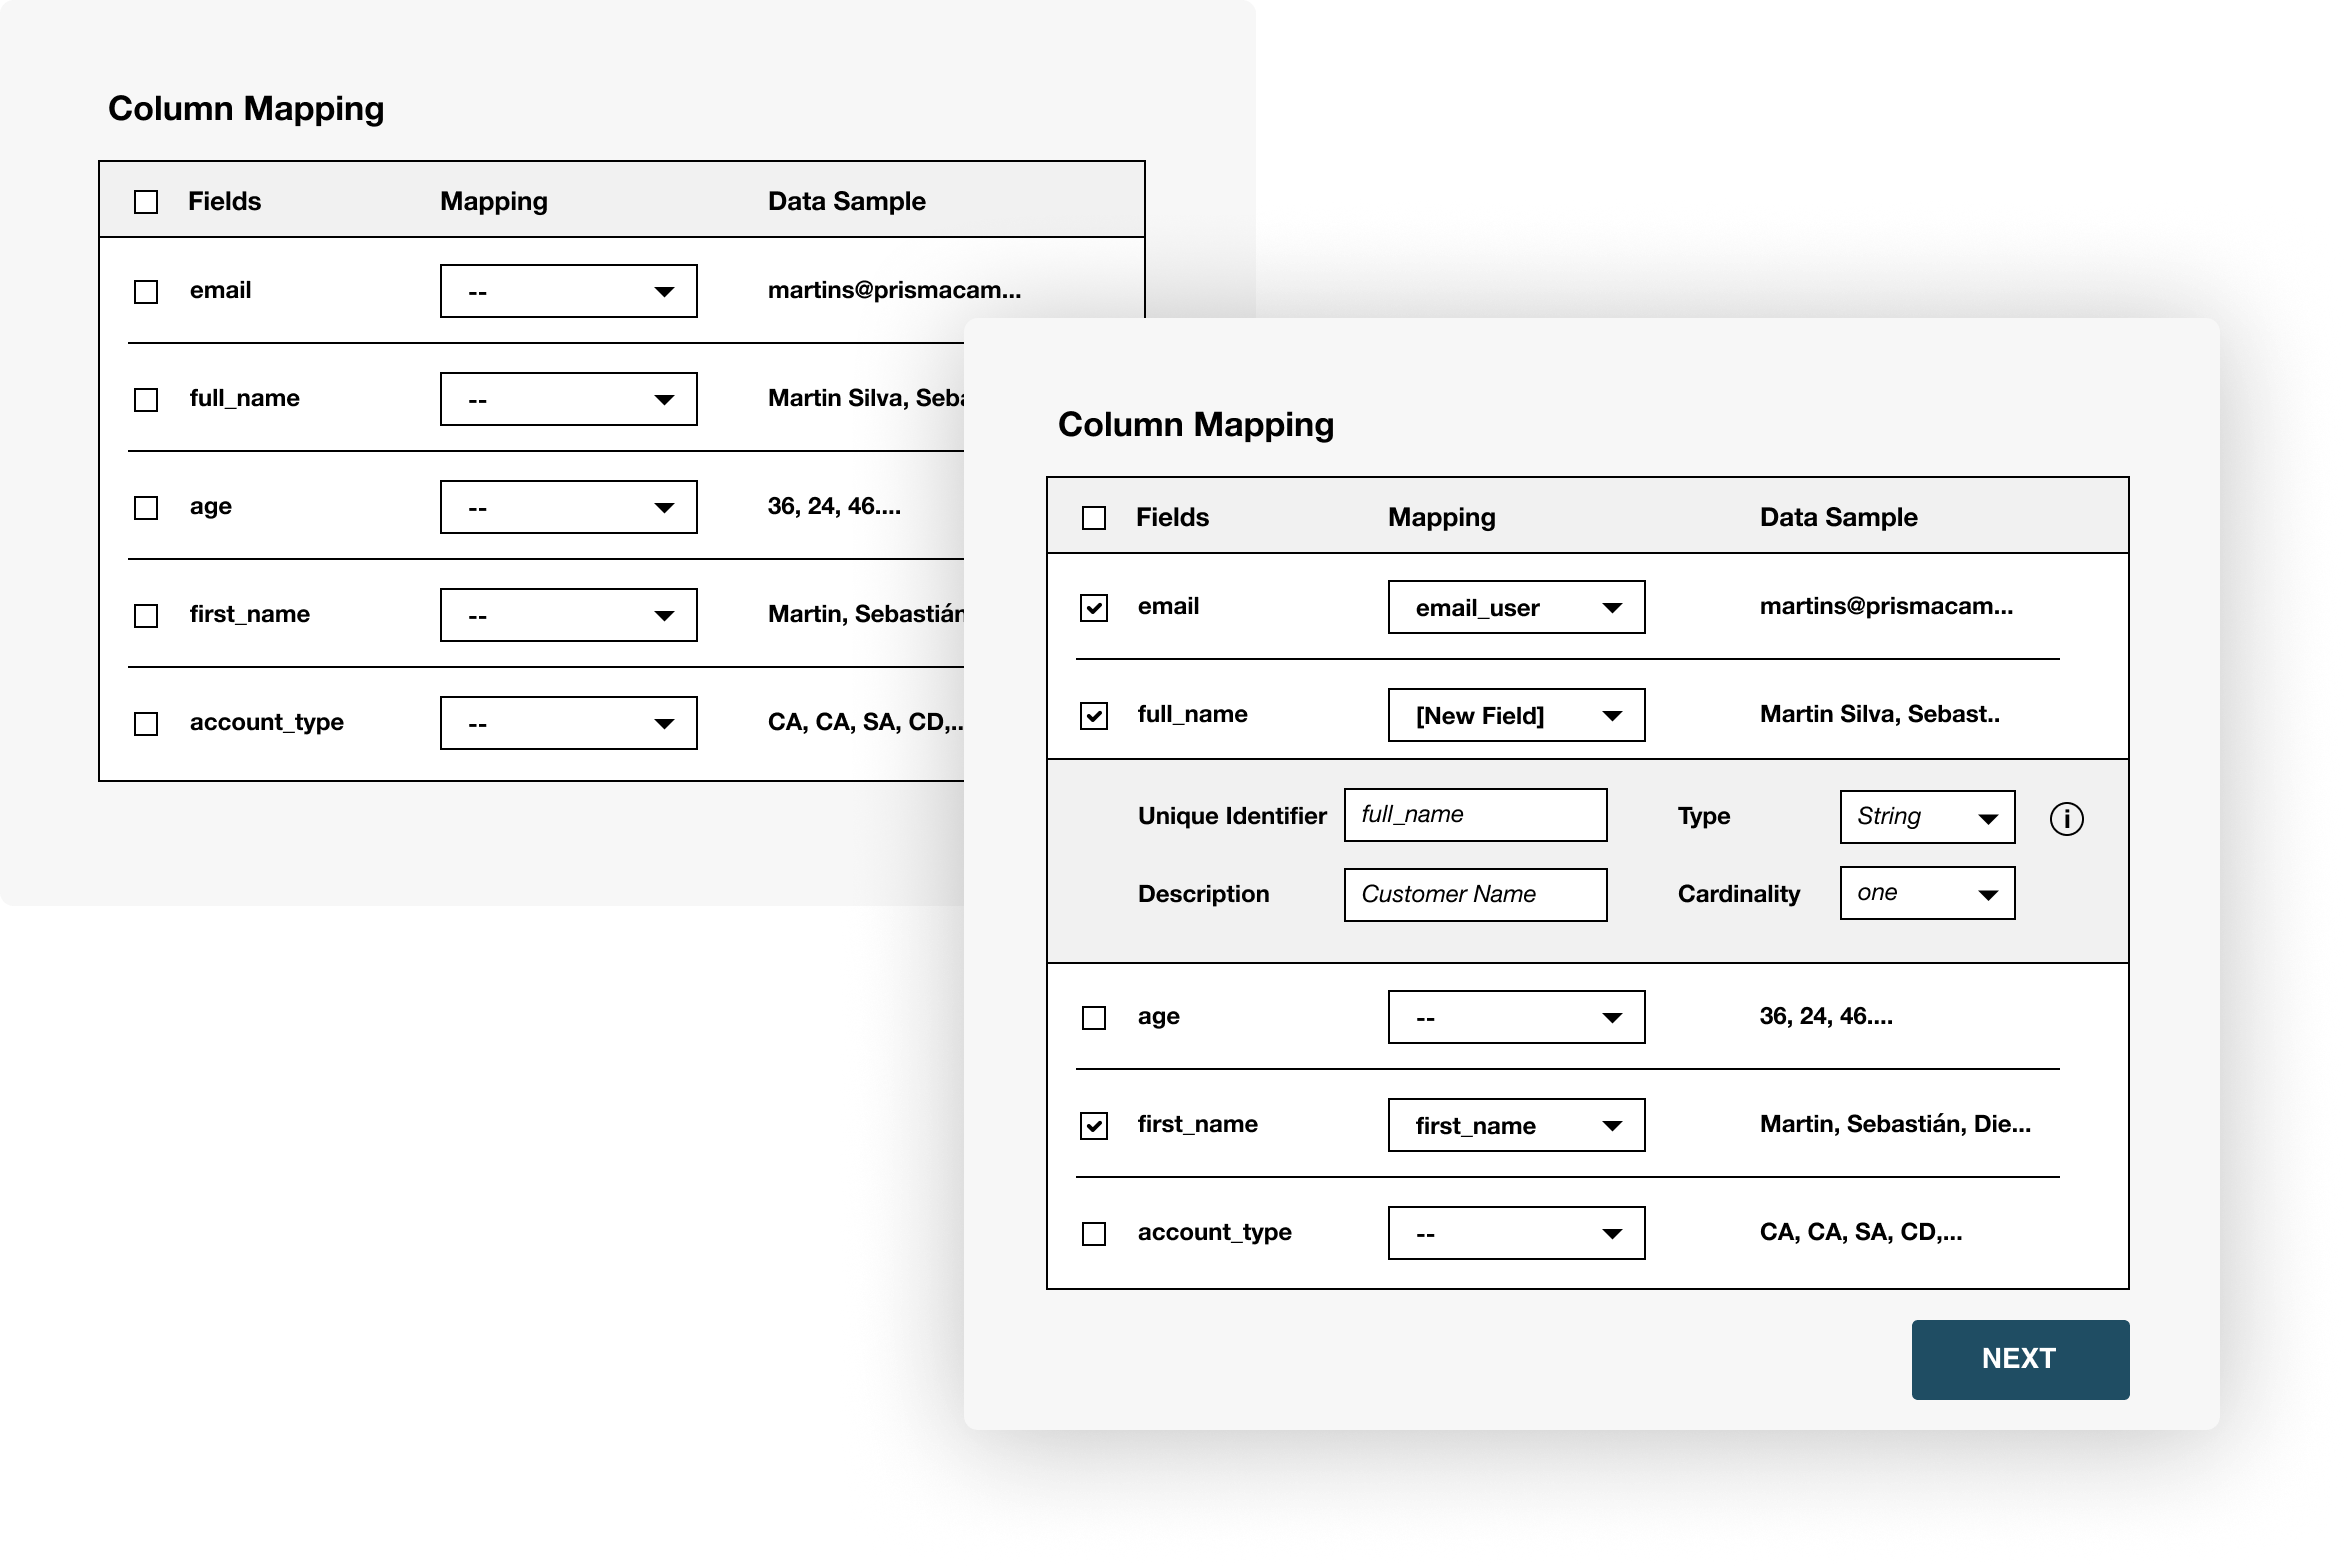
Configure Mapping
Once the sample file is uploaded (with a minimum of 100 rows), the columns are listed as rows, and the system automatically maps the identified fields in the file to those in the Data Model. If no match is found, the user can manually configure the fields or create new ones.
If a field does not exist, the screen allows users to create a new one and define its format.
Feedback
Once the low-fidelity mockups were completed, we scheduled new meetings with clients to assess the efficiency of the solution and continue identifying potential improvements or issues.
The experience was highly productive, and we gained valuable feedback from our clients.
.Easy access and task creation.
.Effective solution for simple data update scenarios.
.Clear visibility into the current status of data.
.They suggest including support for data transformation during mapping.
.They recommend enabling the creation of Computed Fields during mapping.
.They suggested to categorize data sync tasks by type since the list could be long.
.The number of fields to map in some cases makes the creation process more challenging.
.The time required to create mappings causes uncertainty among users.
Second iteration
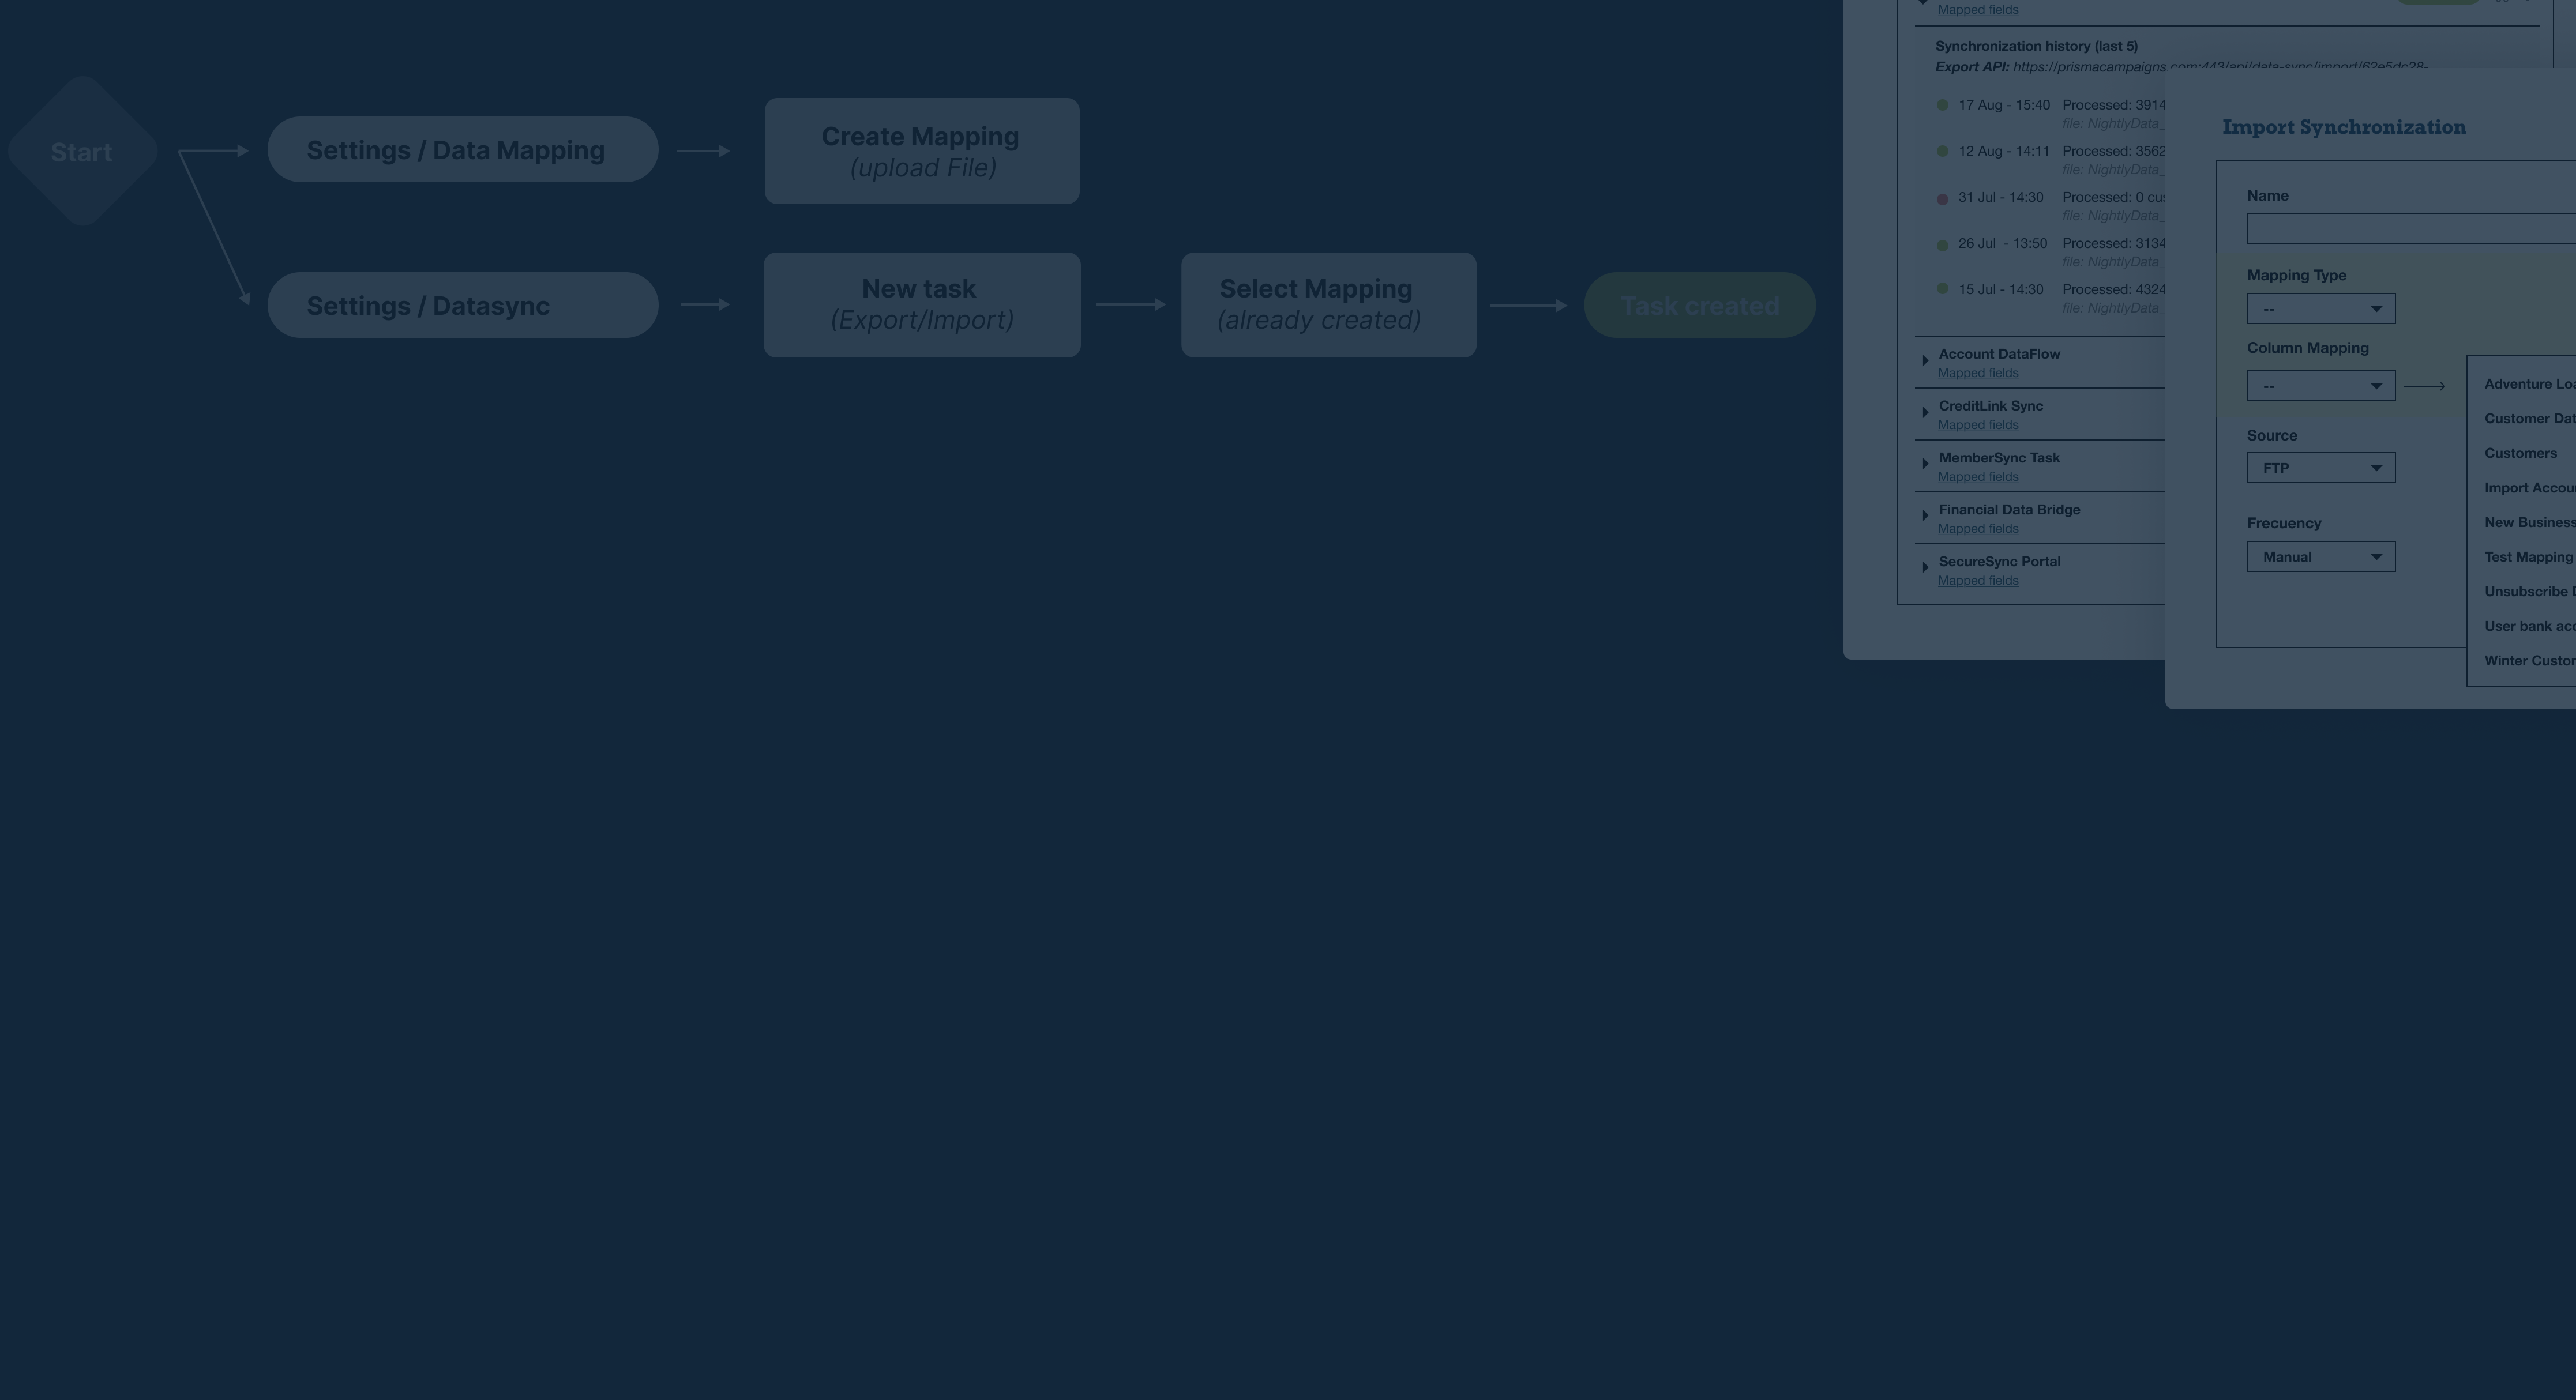
Based on the feedback received from our clients, I propose separating the Column Mapping process from the task creation flow.
This way, the creation of mappings becomes an independent step, allowing users to dedicate as much time as needed without being tied to the synchronization task creation process.

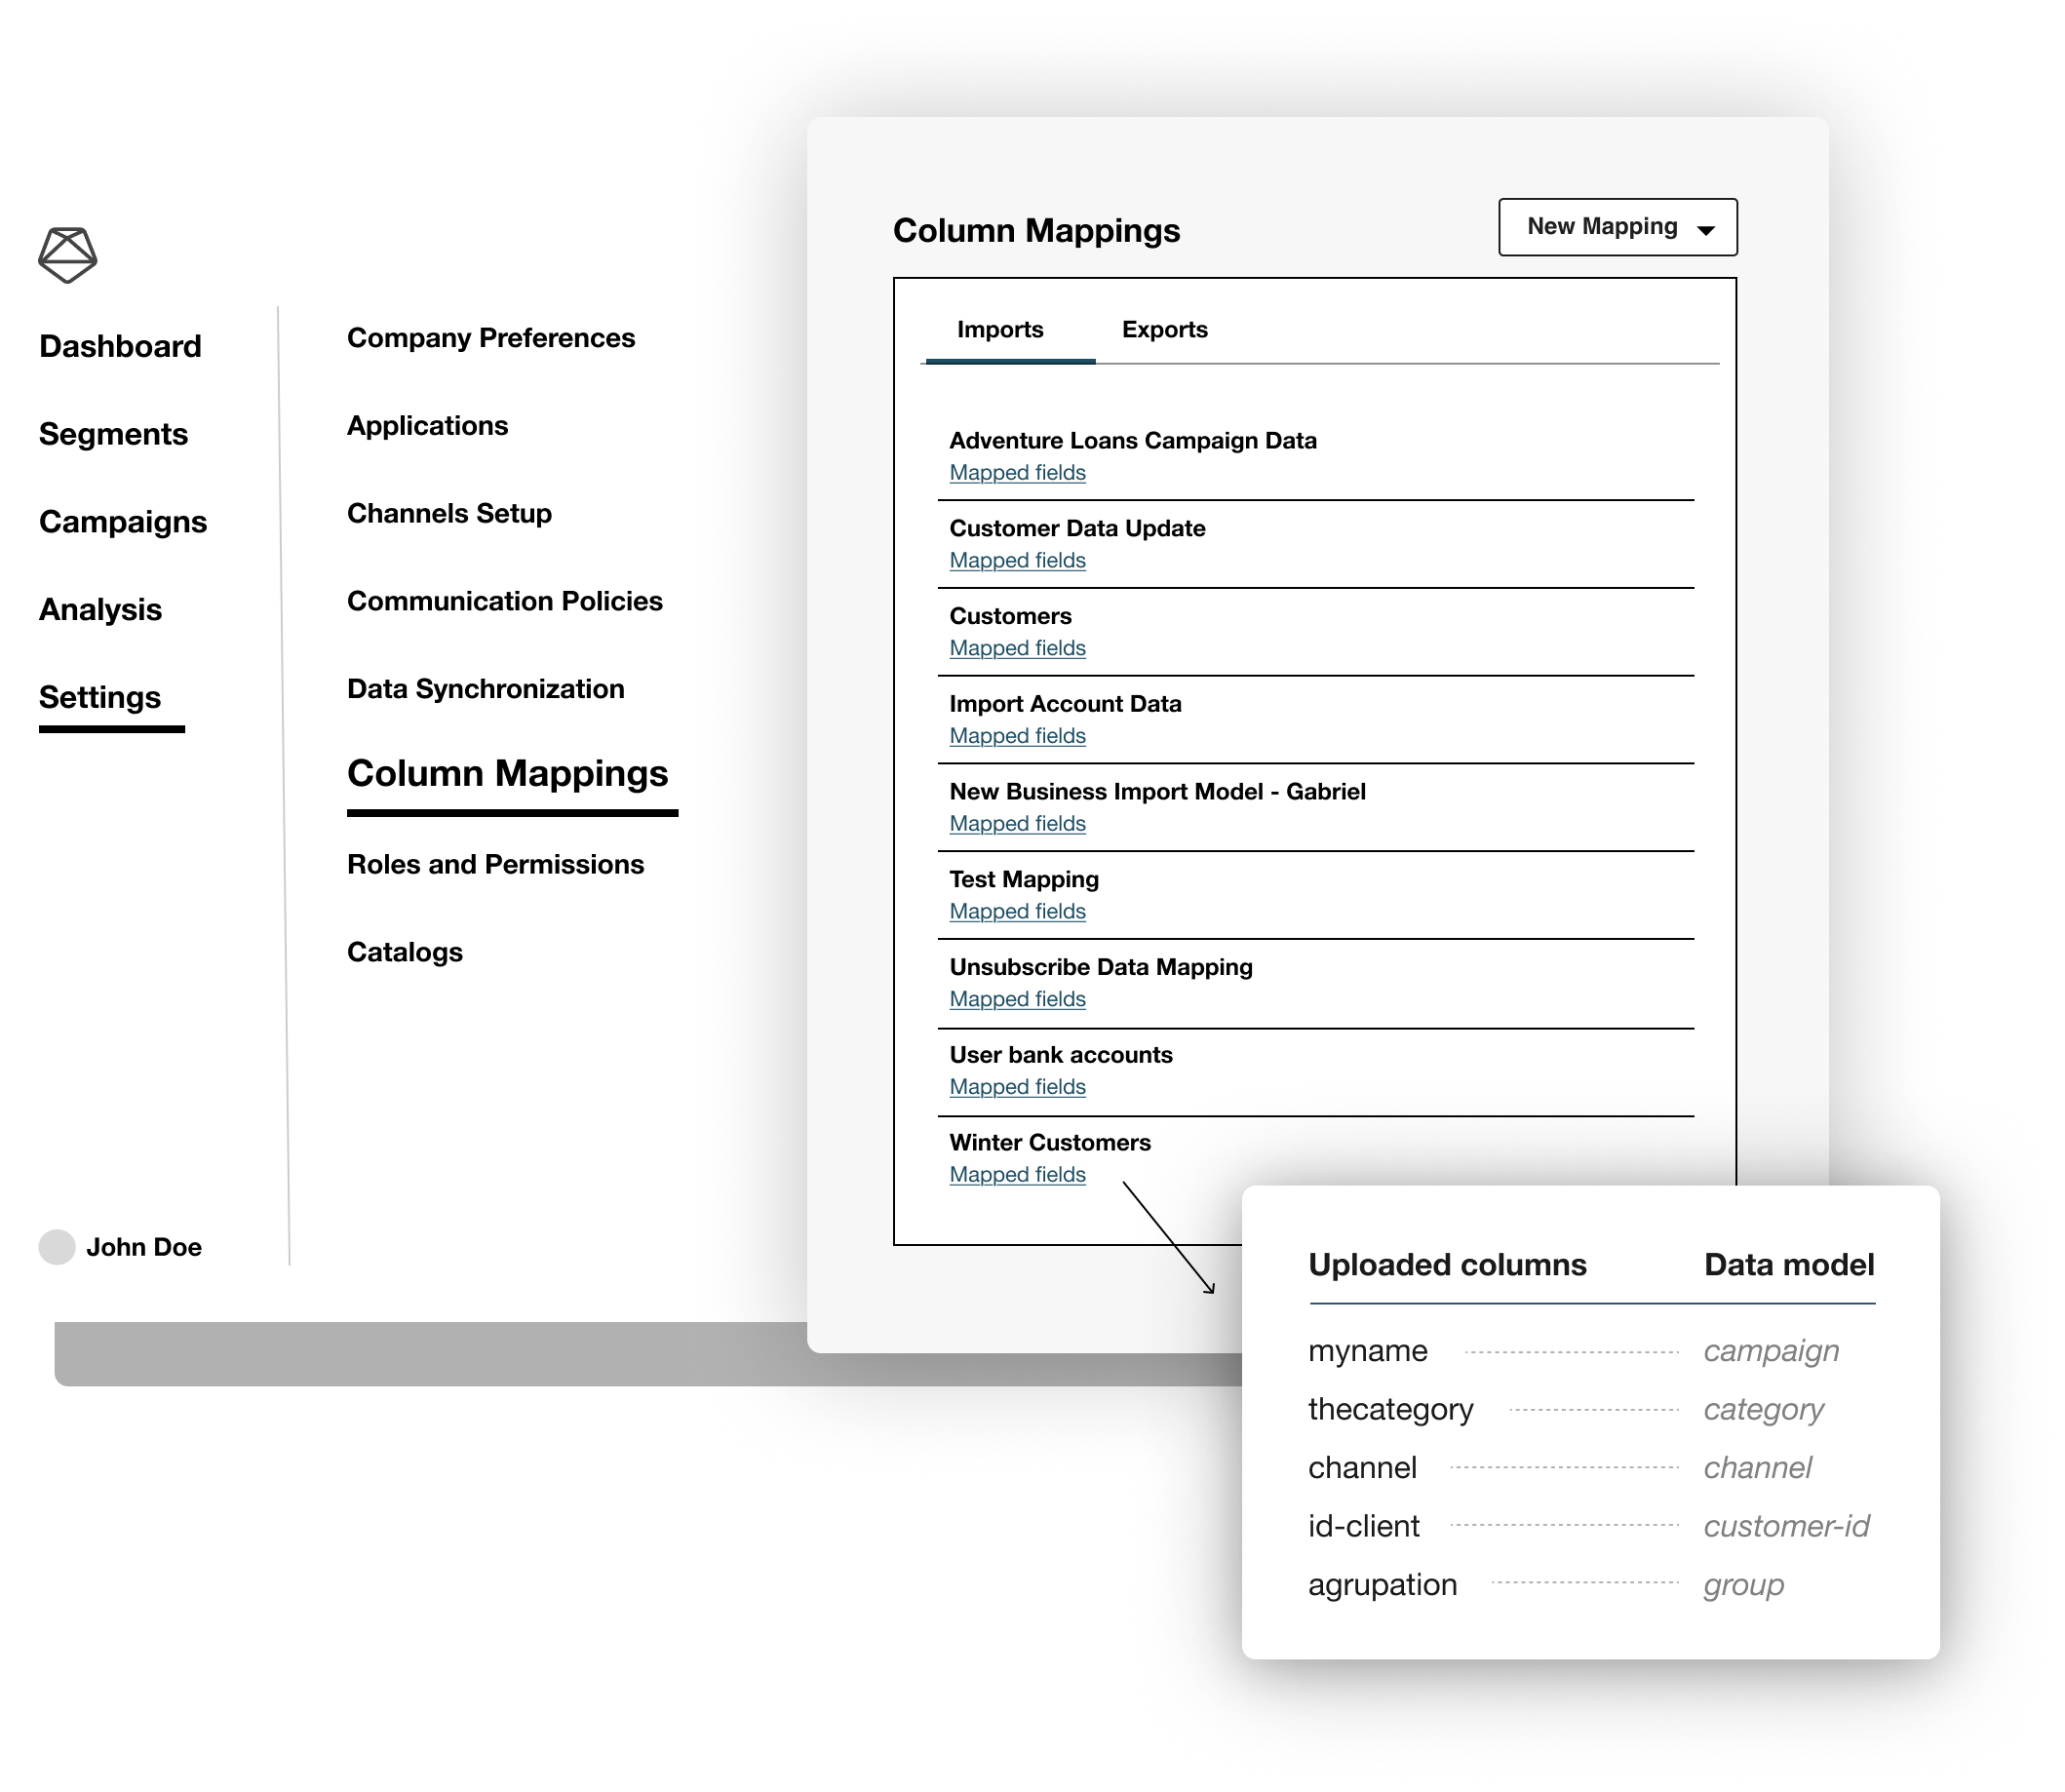
Column Mapping Section
A new screen is created at the same level as Data Synchronization in Settings, where the Column Mappings will be managed.
Advantages of separating mappings:
[Reusability]
The same mapping can be used for multiple tasks.
[Isolation]
Mappings can be worked on and edited independently without needing to modify synchronization tasks.
[Advanced features]
- [Improved field formatting]
Better handling and formatting of fields. - [Data transformation]
Enables transforming data at both input and output stages. - [Computed fields]
Allows the creation of computed fields through expressions.
New Column Mapping
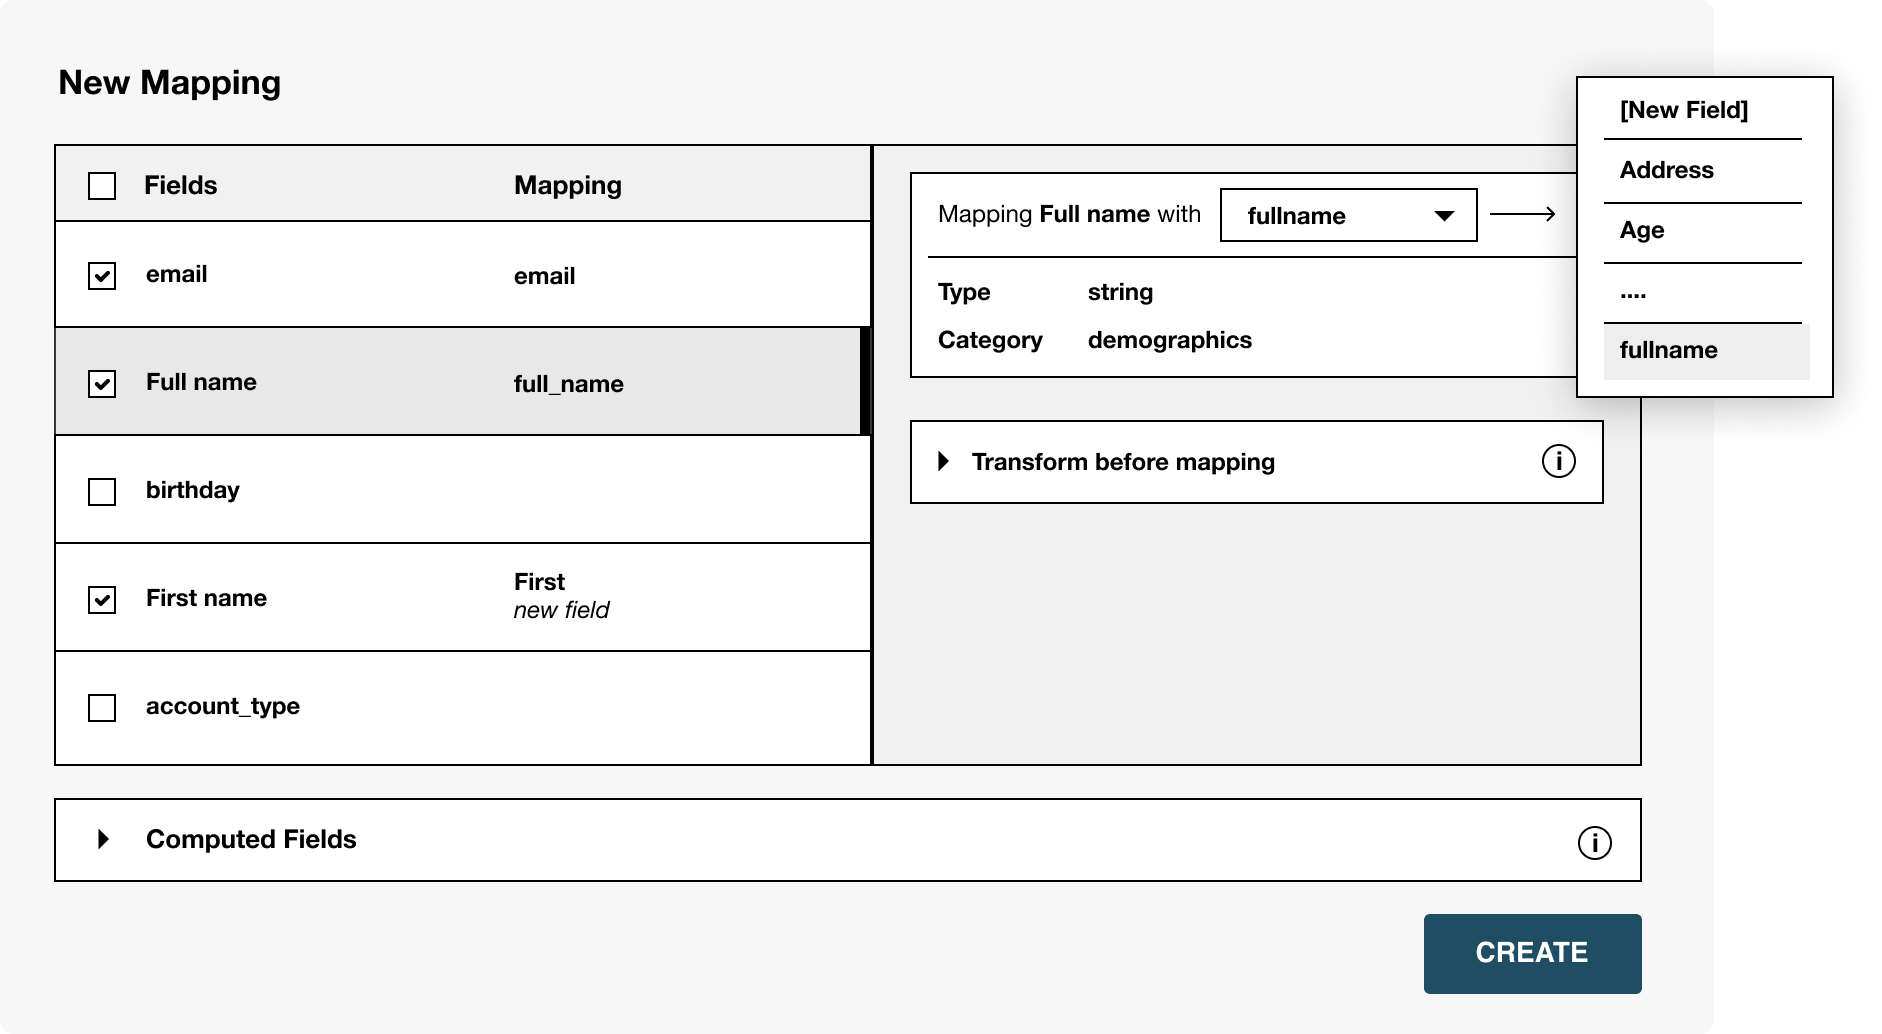
[Simple Scenario]
The creation of mappings is just as easy as in the previous version, allowing fields from the uploaded file to be automatically mapped to the Data Model.
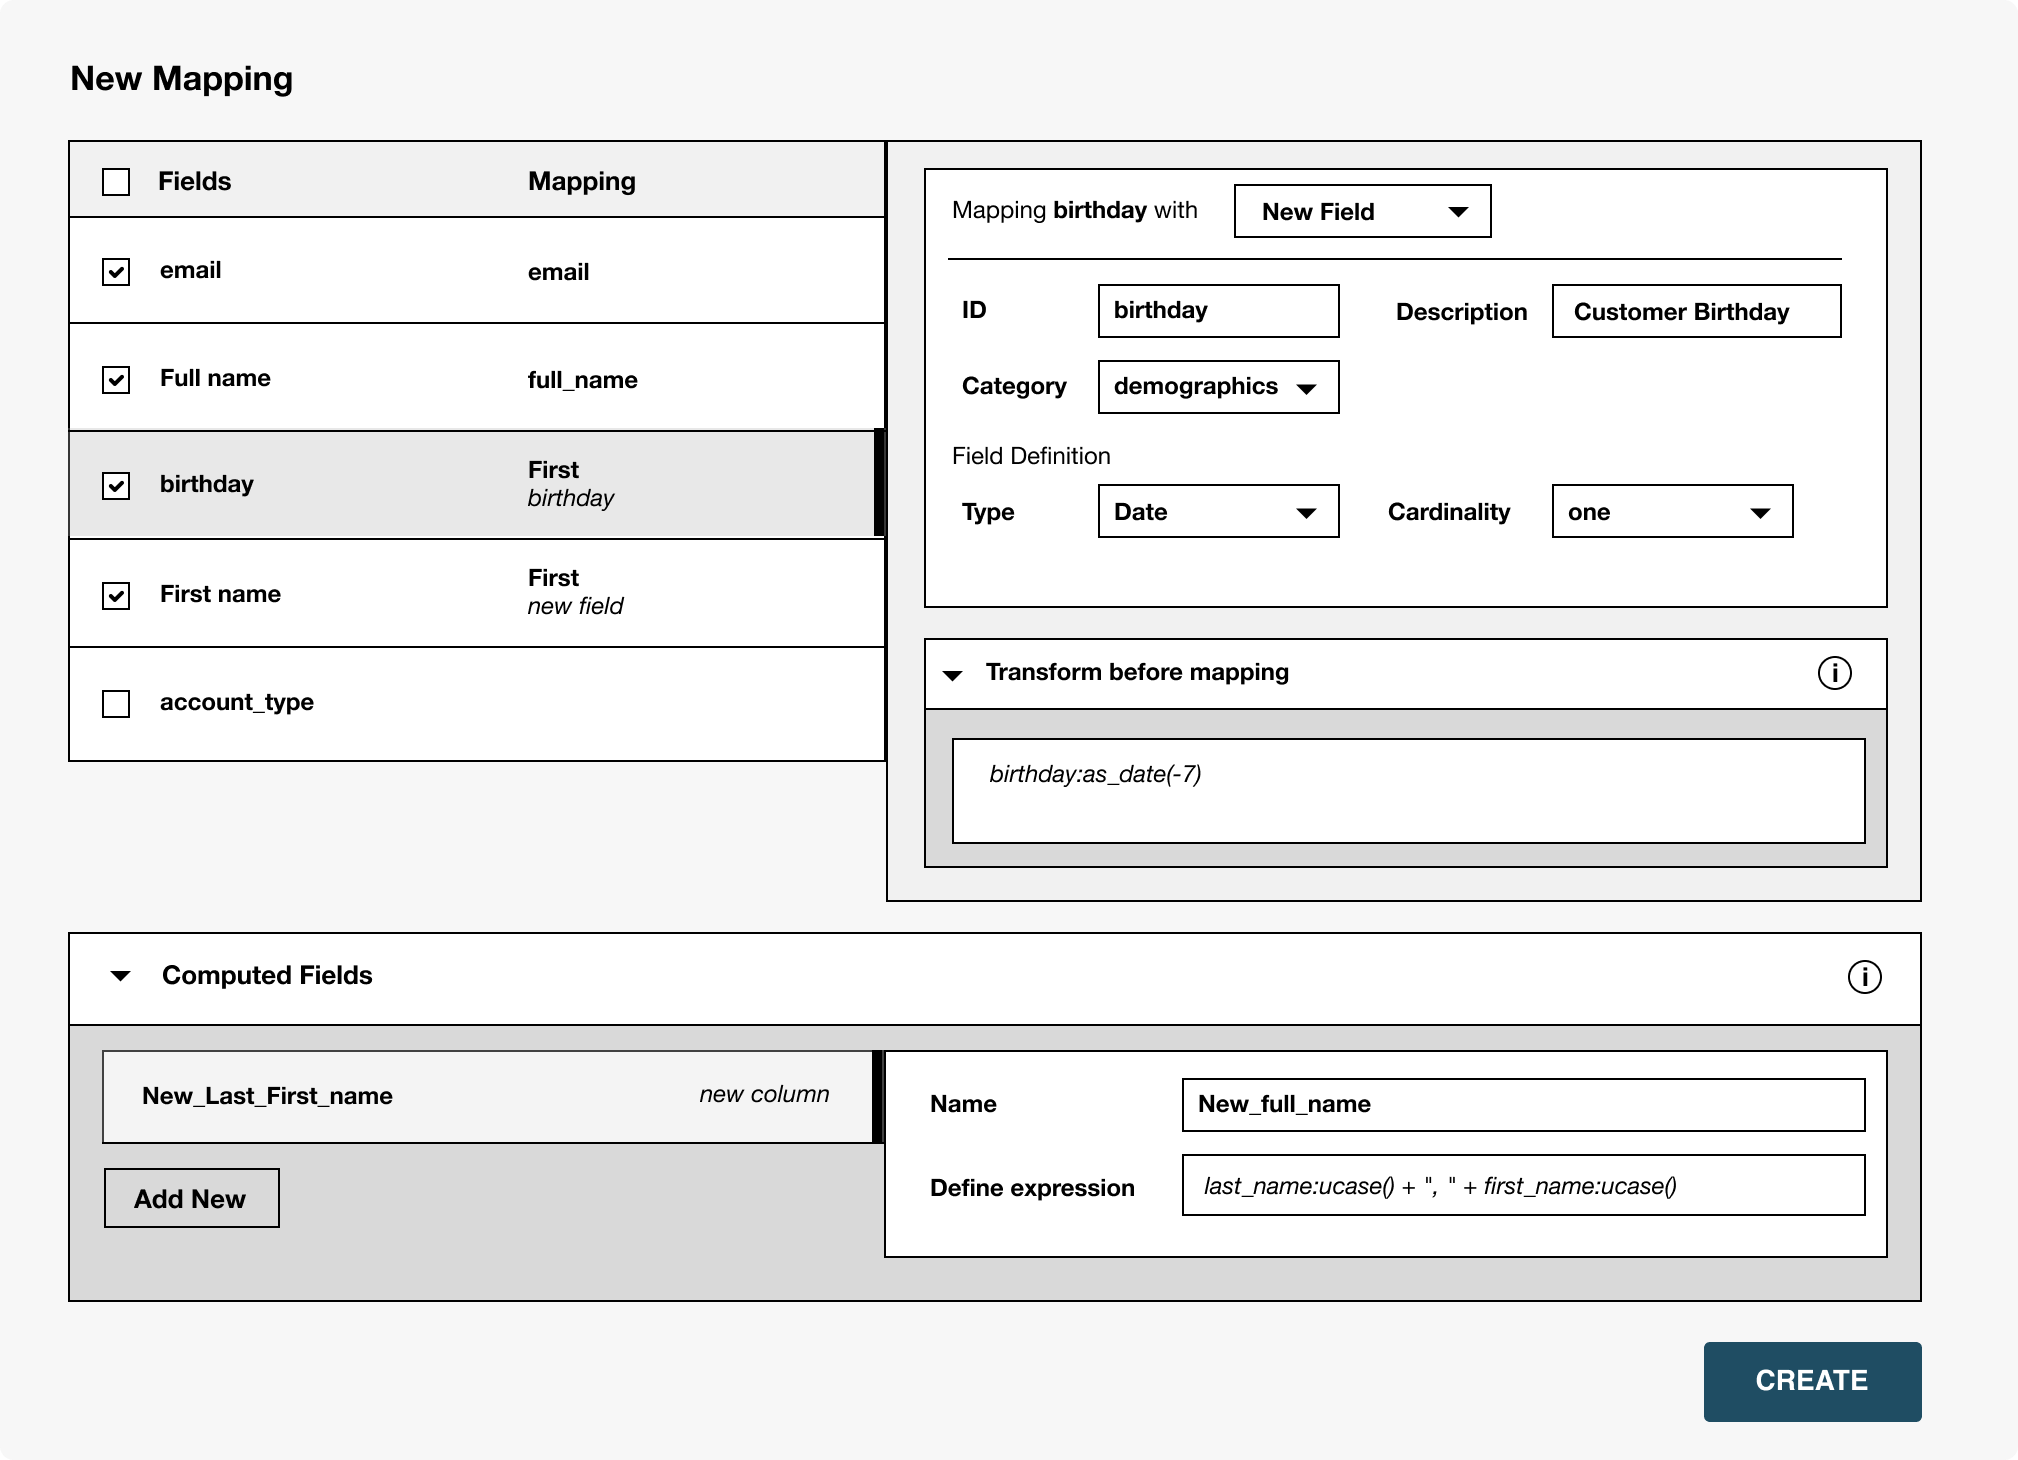
[Advanced]
- A new field is defined for the birthday column, including its format.
- A transformation is applied to the data before it is entered into the platform: birthday:as_date(-7).
- A new field (Computed Field) called New_full_name is created using the expression: last_name:ucase() + ", " + first_name:ucase().
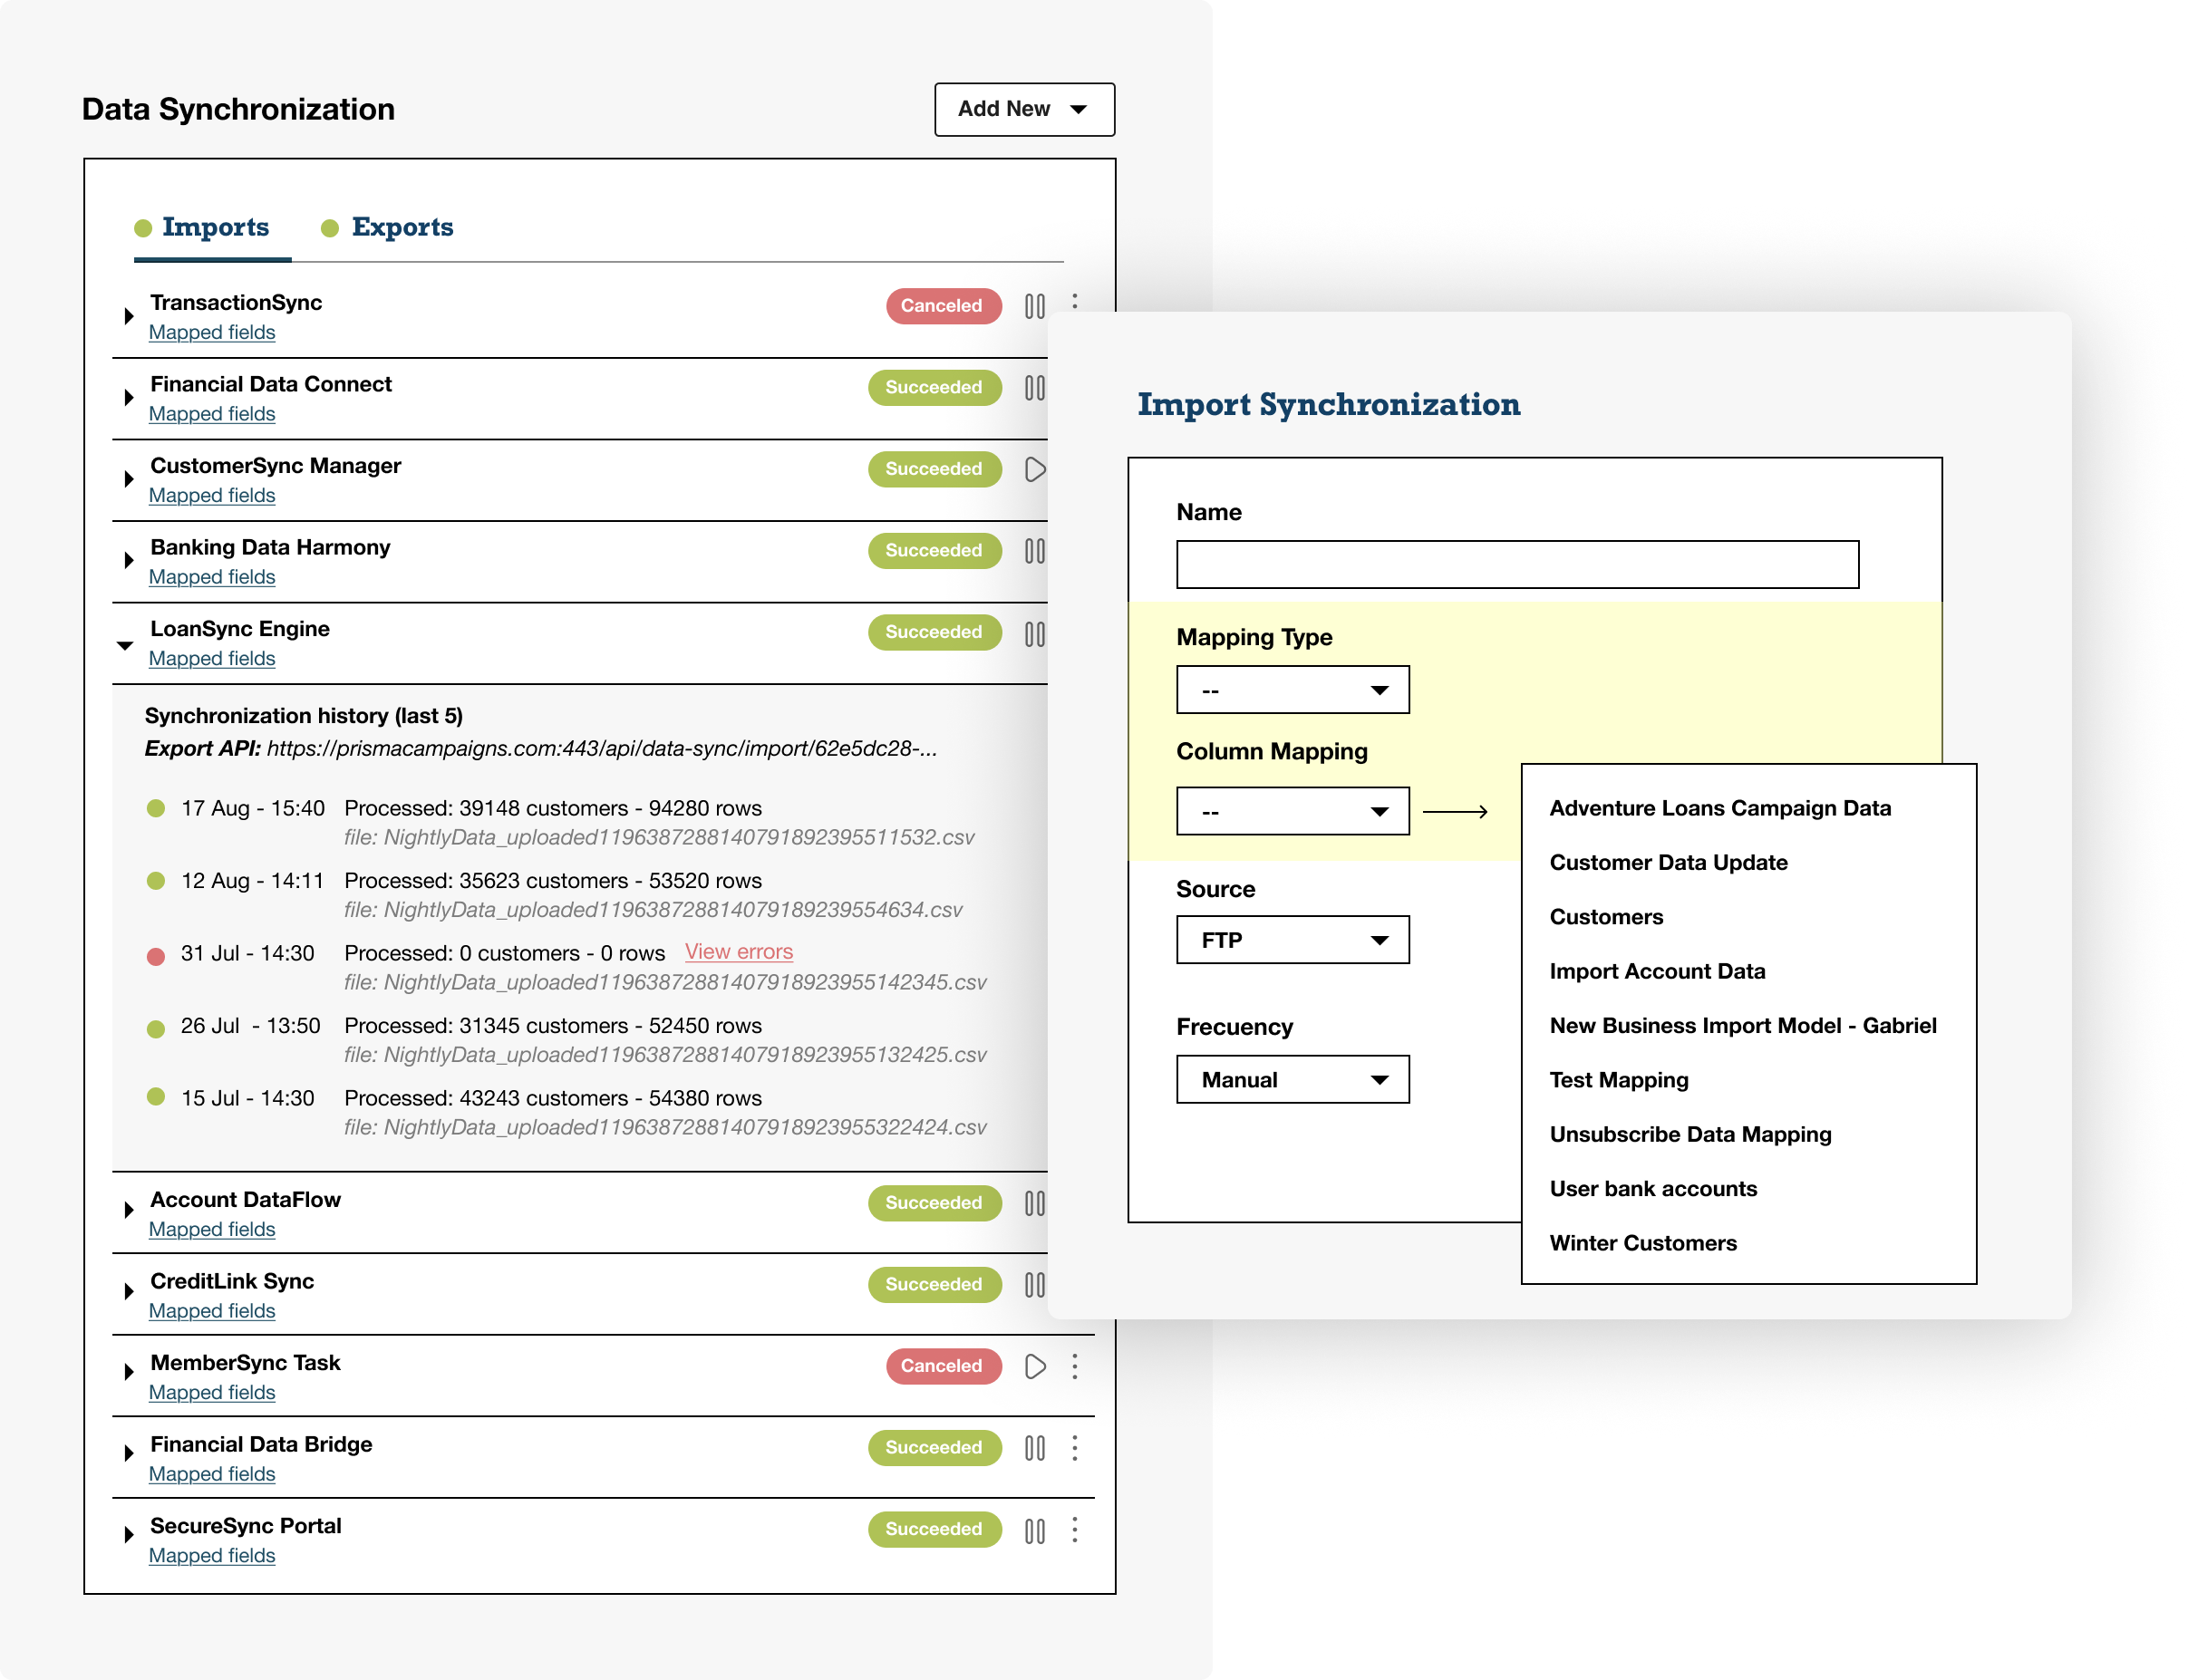
Data Synchronization list
The improvements made to this screen include separating the tasks into Import and Export.
In the task configuration screen, the change was made to select an already created mapping, significantly speeding up the task creation process.
Final Presentation
Once again, after finalizing the mockups, we gathered and presented them to the clients.
They were very appreciative because we were highly responsive in incorporating their suggestions into the designs.
.The benefit of being able to configure the mapping independently was highly valued.
.It improves the workflow for users.
.It provides sufficient granularity to make an impact on the data through transformations and computed fields, both during import and export.
Seeing Results
These measurements were obtained with the help of our customers and their team metrics.
2x
Productivity
30%
decreased error rate
5x
increase data volume
The team's morale improved as they no longer wasted time manually uploading/downloading files.
Customer satisfaction improved by minimizing the number of errors in data handling.
The ease of synchronization allowed clients to utilize more data in their campaigns.
Learnings
Overlooking Interaction Testing
Once we started implementing the solution, I began to notice that some interactions were not well-resolved. It would have been very helpful to have created at least a simple prototype where the elements could be interacted with (especially the grid).
The power of user feedback
Through conversations with clients and users, I discovered how critical it is to actively listen to feedback. This feedback not only highlights areas for improvement but also provides valuable insights into user needs, making the solution more tailored and effective.
Balancing immediate solutions and long-term strategy
While addressing immediate user problems, I learned the importance of stepping back to think about how the solution fits into the broader product vision. It’s essential to ensure that short-term fixes align with long-term scalability and adaptability.